"If you want a happy ending, that depends, of course, on where you stop your story."
Orson Welles
And on where you start it. We may not be professional scientists here on the Farm, but we've all read the classic How to Lie with Statistics, and I assume we've all studed at least basic calculus.
(And we all also know that computer modeling depends on the parameters you chose, or adjust ex post facto: "With four parameters I can fit an elephant, and with five I can make him wiggle his trunk." - John Von Neuman. In science, if data fails to fit models, they adjust the models to fit the data, and keep their jobs and federal grants. In finance, you get fired or lose your bonus.)
Sticking with Orson Welles for today, my point is elementary math: If you select your end point (and your starting point), you can extrapolate out any line from any piece of any graph or curve you want. That's termed "cherry picking." That's why they say that, if you extrapolate the curve of the log graph of the population of Houston from 1950 to 1980, Houston would shortly contain the entire population of the USA.
Climate alarmists are famous for extrapolating from small, selected pieces of data - and also for continual realignment of modeling parameters (which is not science, it's computer gaming).
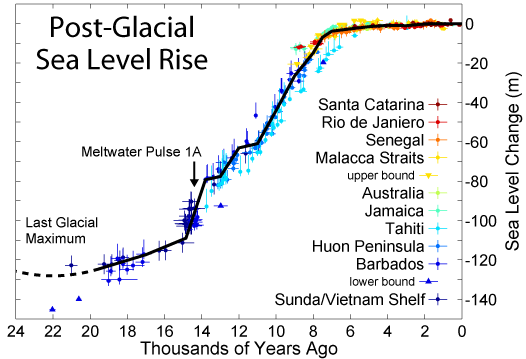
Let's accept that post-glacial global warming has been going on, with dramatic bumps up and down but generally beneficially for humans (not for Wooly Mammoths), for 10,000 years, with the resulting 120-150 meters of ocean rise. (There are many Neolithic villages underwater in the English Channel and the North Sea, many Indian villages underwater 50-60 miles out from the coast of Virginia, etc.) This will continue until the climate tide changes back to the next glaciation in the next few centuries or millennia. Given recent predictions, we are warned to expect at least several decades of global cooling around now. Will it be the Big One? A warning to go long Key Largo real estate?
Here's an amusing alarmist example which is being fed to our benighted, innocent kiddies: Warming Doubles Extreme Coastal Flood Risk Across U.S. They begin:
Global warming has raised global sea level about 8 inches since 1880, and the rate of rise is accelerating. Rising seas dramatically increase the odds of damaging floods from storm surges.
As if it all began in 1880. It's probably closer to 6 inches in the past 200 years, but let that pass. The real question is why they picked 1880 instead of saying "Rising seas since 1800 increase the risk of damaging storm surges"? The line would be less scarey. Or better yet, why not say "Rising seas since 15,000 BC increase the risk of damaging storm surges"? Look at this graph. Why not draw your average beginning at 1800?
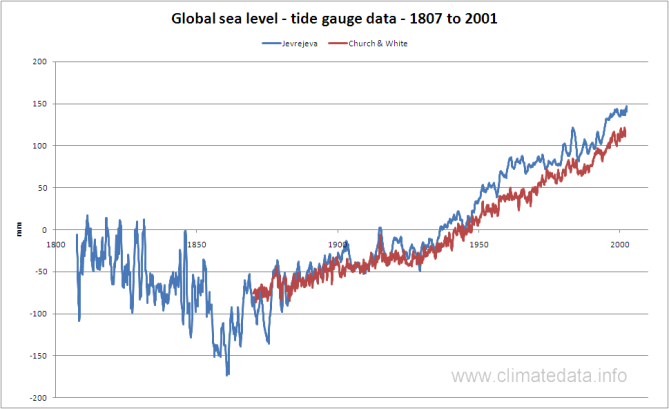
Aha. they picked a low point and a high point on the curvacious historical graph, and are extrapolating from that teensy piece of it to instill terror. If you picked 1800 as your starting point, your line would look different.
And, as we posted yesterday, if you picked 18,000 years ago, your take on the data would be quite different again. You would relax and turn on the basketball game. Go Huskies - and we may need real Huskies here soon:
Call me paranoid if you want, but my view is that there is an unspoken alliance (not a conscious conspiracy) between greedy scientists and greedy governments of all sorts to make a big deal out of a big nothing. I hope to survive the big chill to see that finally people will have admitted, as they finally admitted about the imminent Ice Age scare of the 1970s - that it is pure hype.
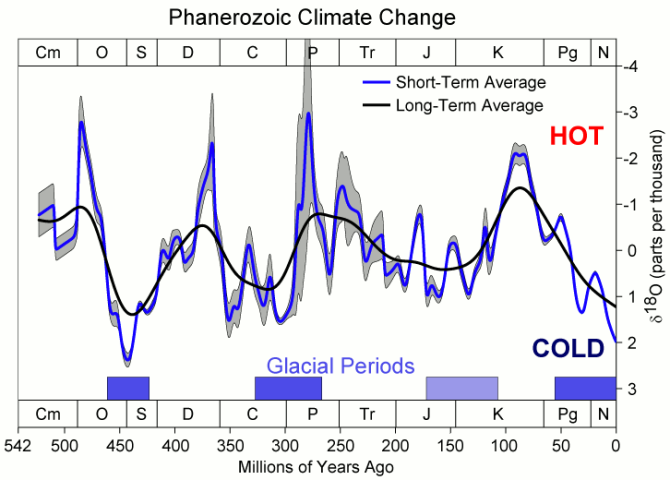
But, what the heck, let's step even further backwards from the frame for the really Big Picture. I'll bet teacher never told you that we remain in a cold spell, historically-speaking. Yes, indeed. Polar ice caps are not normal for planet Earth. The earth doesn't have a fever - it has a very bad cold right now: